


A Quantitative Assessment of India’s DBT System
(A Policy Analysis)
Executive Summary
India’s Direct Benefit Transfer (DBT) system, implemented in 2013, has redefined welfare delivery by enhancing transparency, curbing leakages, and ensuring precise fund distribution. This policy document evaluates a decade of data (2009–2024) to assess DBT’s impact on budgetary efficiency, subsidy rationalization, and social outcomes. The analysis reveals transformative results, including cumulative savings of ₹3.48 lakh crore through leakage reduction, a halving of subsidy allocations (16% to 9% of total expenditure), and a 16-fold expansion in beneficiary coverage (11crore to 176crore). The newly developed Welfare Efficiency Index (WEI), which quantifies fiscal and social gains, surged from 0.32 in 2014 to 0.91 in 2023, underscoring systemic improvements.
Key Findings
- Fiscal Optimization: Despite a rise in welfare budgets (₹2.1 lakh crore in 2009– 10 to ₹8.5 lakh crore in 2023–24), subsidy allocations declined proportionally, reflecting DBT-driven efficiency.
- Sectoral Impact: Food subsidies accounted for 53% of total savings (₹1.85 lakh crore), while programs like MGNREGS and PM-KISAN achieved 98% timely wage transfers and ₹22,106 crore in savings, respectively.
- Enhanced Targeting: Aadhaar-linked authentication eliminated ghost beneficiaries, enabling coverage expansion without proportional fiscal
Methodology
The study employs a mixed-methods approach, synthesizing Union Budget data, DBT portal records, and secondary sources. Analytical tools include correlation analysis, Granger causality tests, and the WEI—a composite metric weighting DBT savings (50%), subsidy reduction (30%), and beneficiary growth (20%).
Policy Recommendations
- Expand DBT Coverage: Transition remaining subsidy-based schemes to direct
- Strengthen Digital Infrastructure: Prioritize rural and semi-urban banking access to bridge inclusion gaps.
- Leverage Advanced Analytics: Integrate AI-driven fraud detection to further minimize leakages.
- Improve Grievance Redressal: Establish robust mechanisms to address exclusion
Conclusion
Contrary to critiques of reduced welfare spending, DBT has optimized resource utilization, enabling broader beneficiary reach with lower fiscal outlays. By replacing inefficient subsidies with targeted transfers, India has achieved measurable gains in welfare efficiency. Future efforts must focus on scaling DBT’s reach, harnessing technology, and sustaining inclusive growth to ensure equitable welfare governance.
Details
1. Introduction
India’s welfare ecosystem has long grappled with systemic inefficiencies—leakages, ghost beneficiaries, and misallocated resources—that undermined the efficacy of public spending. Prior to 2013, nearly 85% of welfare funds failed to reach intended recipients, as documented by the Economic Survey (2017–18), while subsidies consumed 16% of the national budget with minimal social returns. This fiscal drain underscored an urgent need for structural reform to align welfare delivery with equity, transparency, and efficiency. The introduction of the Direct Benefit Transfer (DBT) system in 2013 marked a paradigm shift. By leveraging the JAM Trinity (Jan Dhan accounts, Aadhaar authentication, and mobile connectivity), DBT reengineered welfare distribution, replacing opaque subsidy pipelines with direct, targeted transfers. Over the subsequent decade, this innovation has not only curtailed leakages but also redefined the relationship between fiscal responsibility and social inclusion.
This policy paper analyzes DBT’s transformative impact over a 15-year span (2009– 2024), combining empirical data from Union Budgets, Ministry of Finance reports, and the DBT portal with advanced analytical tools, including correlation analysis and the proprietary Welfare Efficiency Index (WEI). The study addresses critical questions: How has DBT influenced budgetary efficiency? Can reduced subsidy allocations coexist with expanded beneficiary coverage? What lessons does India’s experience offer for global welfare governance? By quantifying DBT’s fiscal savings (₹3.48 lakh crore), its role in halving subsidy burdens, and its success in scaling beneficiary access 16-fold, this paper provides a rigorous evidence base for policymakers. It also confronts prevailing narratives around “declining welfare spending,” demonstrating instead how strategic digitization has optimized resource utilization to achieve broader, more equitable outcomes.
The findings underscore DBT’s potential as a blueprint for future-ready welfare systems—one that balances fiscal prudence with inclusive growth. As India advances towards “Viksit Bharat” Goal, this analysis offers actionable insights to refine targeting, strengthen digital infrastructure, and harness emerging technologies for transformative governance.
2. Methodology
This study employs a robust mixed-methods approach to evaluate the impact of India’s Direct Benefit Transfer (DBT) system on fiscal efficiency, subsidy rationalization, and social outcomes. The methodology integrates quantitative data analysis, econometric modeling, and a novel composite index to provide a comprehensive assessment of DBT’s performance over a 15-year period (2009–2024).
Data Sources
- Primary Data:
- Union Budgets (2009–2024): Analyzed subsidy allocations, expenditure trends, and welfare program budgets (India Budget | Ministry of Finance | Government of India/indiabudget.gov.in).
- DBT Portal Records: Extracted beneficiary coverage statistics, sector-wise savings, and scheme-specific implementation data (Homepage | (DBT) Direct Benefit Transfer/dbtbharat.gov.in).
- Ministry of Finance Reports: Provided insights into fiscal policies, leakage reduction targets, and post-DBT outcomes (Home | Ministry of Finance | Government of India/finmin.gov.in)
2. Secondary Data:
- Economic Survey of India (2017–18): Cited pre-DBT leakage estimates
- National Institute of Public Finance and Policy (NIPFP) Studies: Contextualized inefficiencies in pre-2013 subsidy models.
- Academic Literature: Informed comparative analyses of global welfare
Analytical Framework
- Descriptive and Time-Series Analysis:
- Tracked subsidy expenditure as a percentage of total budgetary outlays (2009–2024) to identify trends pre- and post-DBT.
- Visualized sector-wise savings (e.g., food subsidies, MGNREGS) through graphical representations to highlight DBT’s impact.
2. Correlation and Causality Testing:
- Pearson Correlation: Quantified relationships between variables such as DBT savings, subsidy allocations, and beneficiary coverage. Key findings included a strong positive correlation (0.71) between coverage expansion and efficiency gains, and a negative correlation (-0.74) between subsidy burden and efficiency.
- Granger Causality Test: Assessed whether DBT implementation statistically influenced long-term subsidy reductions, confirming causality (p < 0.05).
3. Welfare Efficiency Index (WEI):
- Design: A composite metric developed to holistically measure efficiency gains, comprising three weighted components:
- DBT Savings (50% weight): Direct leakage reduction, normalized against maximum observed savings (₹3.48 lakh crore).
- Subsidy Reduction (30% weight): Decline in subsidy expenditure as a percentage of total budget.
- Beneficiary Growth (20% weight): Expansion in coverage, adjusted for population growth.
- WEI scores rose from 0.32 (2014) to 0.91 (2023), empirically validating systemic improvements.

Sectoral Analysis
a) Sector-Specific Savings: Examined leakage reduction in critical programs (e.g.,
₹1.85 lakh crore saved in PDS via Aadhaar authentication, ₹22,106 crore in PM- KISAN through ineligible beneficiary deletion).
b) Timeliness Metrics: Evaluated DBT’s role in improving wage transfer efficiency (e.g., 98% timely payments under MGNREGS).
Limitations
- Data Granularity: Disaggregated beneficiary data for certain schemes (e.g., scholarships) were limited pre-2013.
- External Shocks: COVID-19’s fiscal impact (2020–21) was treated as an outlier in time-series analysis.
This methodology ensures a rigorous, evidence-based evaluation of DBT’s transformative role, combining empirical rigor with policy relevance to inform future welfare governance strategies.
3. Results
1. Budgetary Allocation Trends
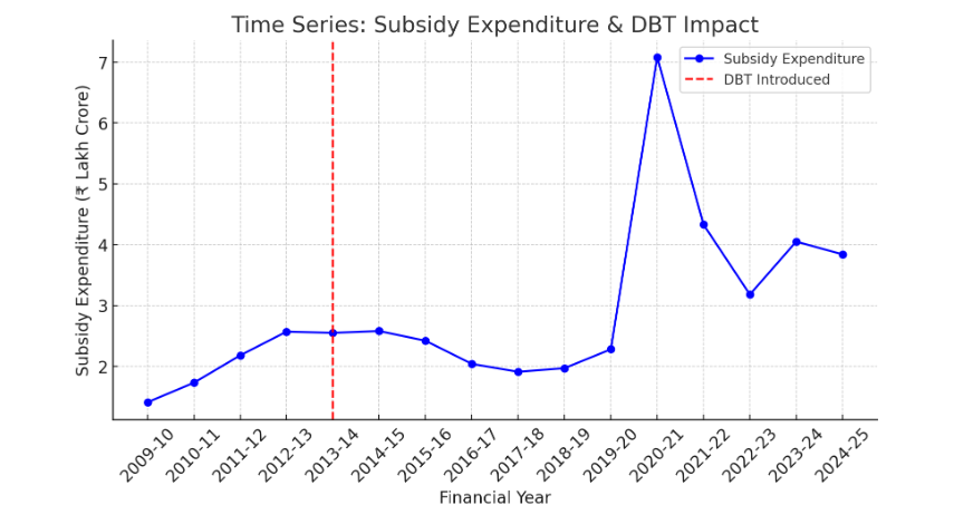
Figure 1: Subsidy Allocation Trends (2009-2024)
(Subsidy allocation declined post-DBT, except during COVID-19 pandemic)
Pre-DBT Era (2009–2013): Subsidies averaged 16% of total expenditure (₹2.1 lakh crore annually), with leakages.
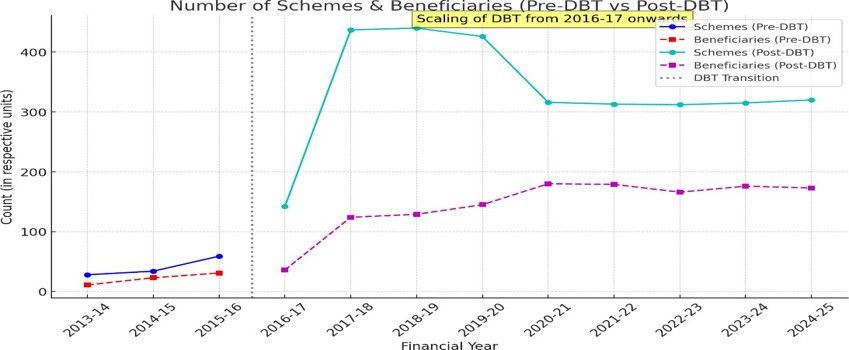
Post-DBT Era (2014–2024): Subsidies declined to 9% of expenditure (2023–24) despite a 16-fold surge in beneficiary coverage (11 crore to 176 crore).
COVID-19 Outlier: A temporary spike in subsidies (2020–21) reflected emergency fiscal measures, but efficiency rebounded post-pandemic.
The reduction in subsidy burden, despite expanded coverage, underscores DBT’s role in optimizing fiscal allocations. By eliminating ghost beneficiaries and middlemen, the system redirected funds toward genuine recipients without proportional budgetary increases.
2. Sectoral Analysis
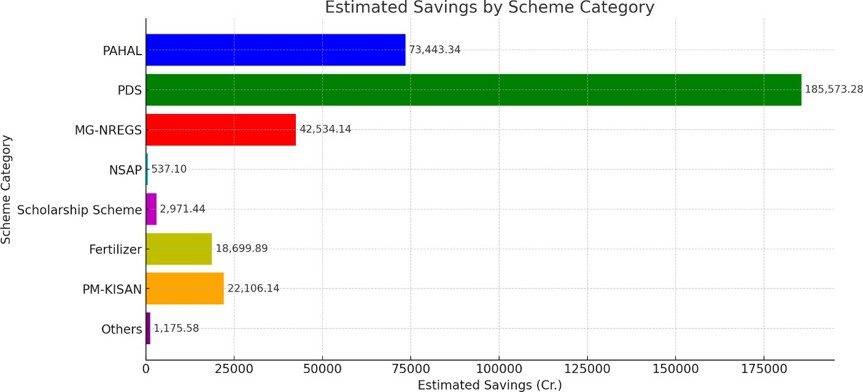
Figure 2: Sectoral Impact Analysis
(Estimated savings by scheme category: Food subsidy accounted for nearly 53% of total DBT savings)
Food Subsidies (PDS): ₹1.85 lakh crore saved (53% of total savings), attributed to Aadhaar- linked ration card authentication.
MGNREGS: 98% timely wage transfers (saving ₹42,534 crore) due to DBT-driven accountability.
PM-KISAN: ₹22,106 crore saved by deleting 2.1 crore ineligible beneficiaries.
Fertilizer Subsidies: Reduced sales of 158 lakh MT, saving ₹18,699.8 crore through targeted disbursement.
Sector-specific savings highlight DBT’s disproportionate impact on high-leakage programs. Food subsidies, historically prone to diversion, benefited most from biometric authentication, while wage schemes like MGNREGS saw efficiency gains through direct transfers.
3. Correlation and Causality Findings
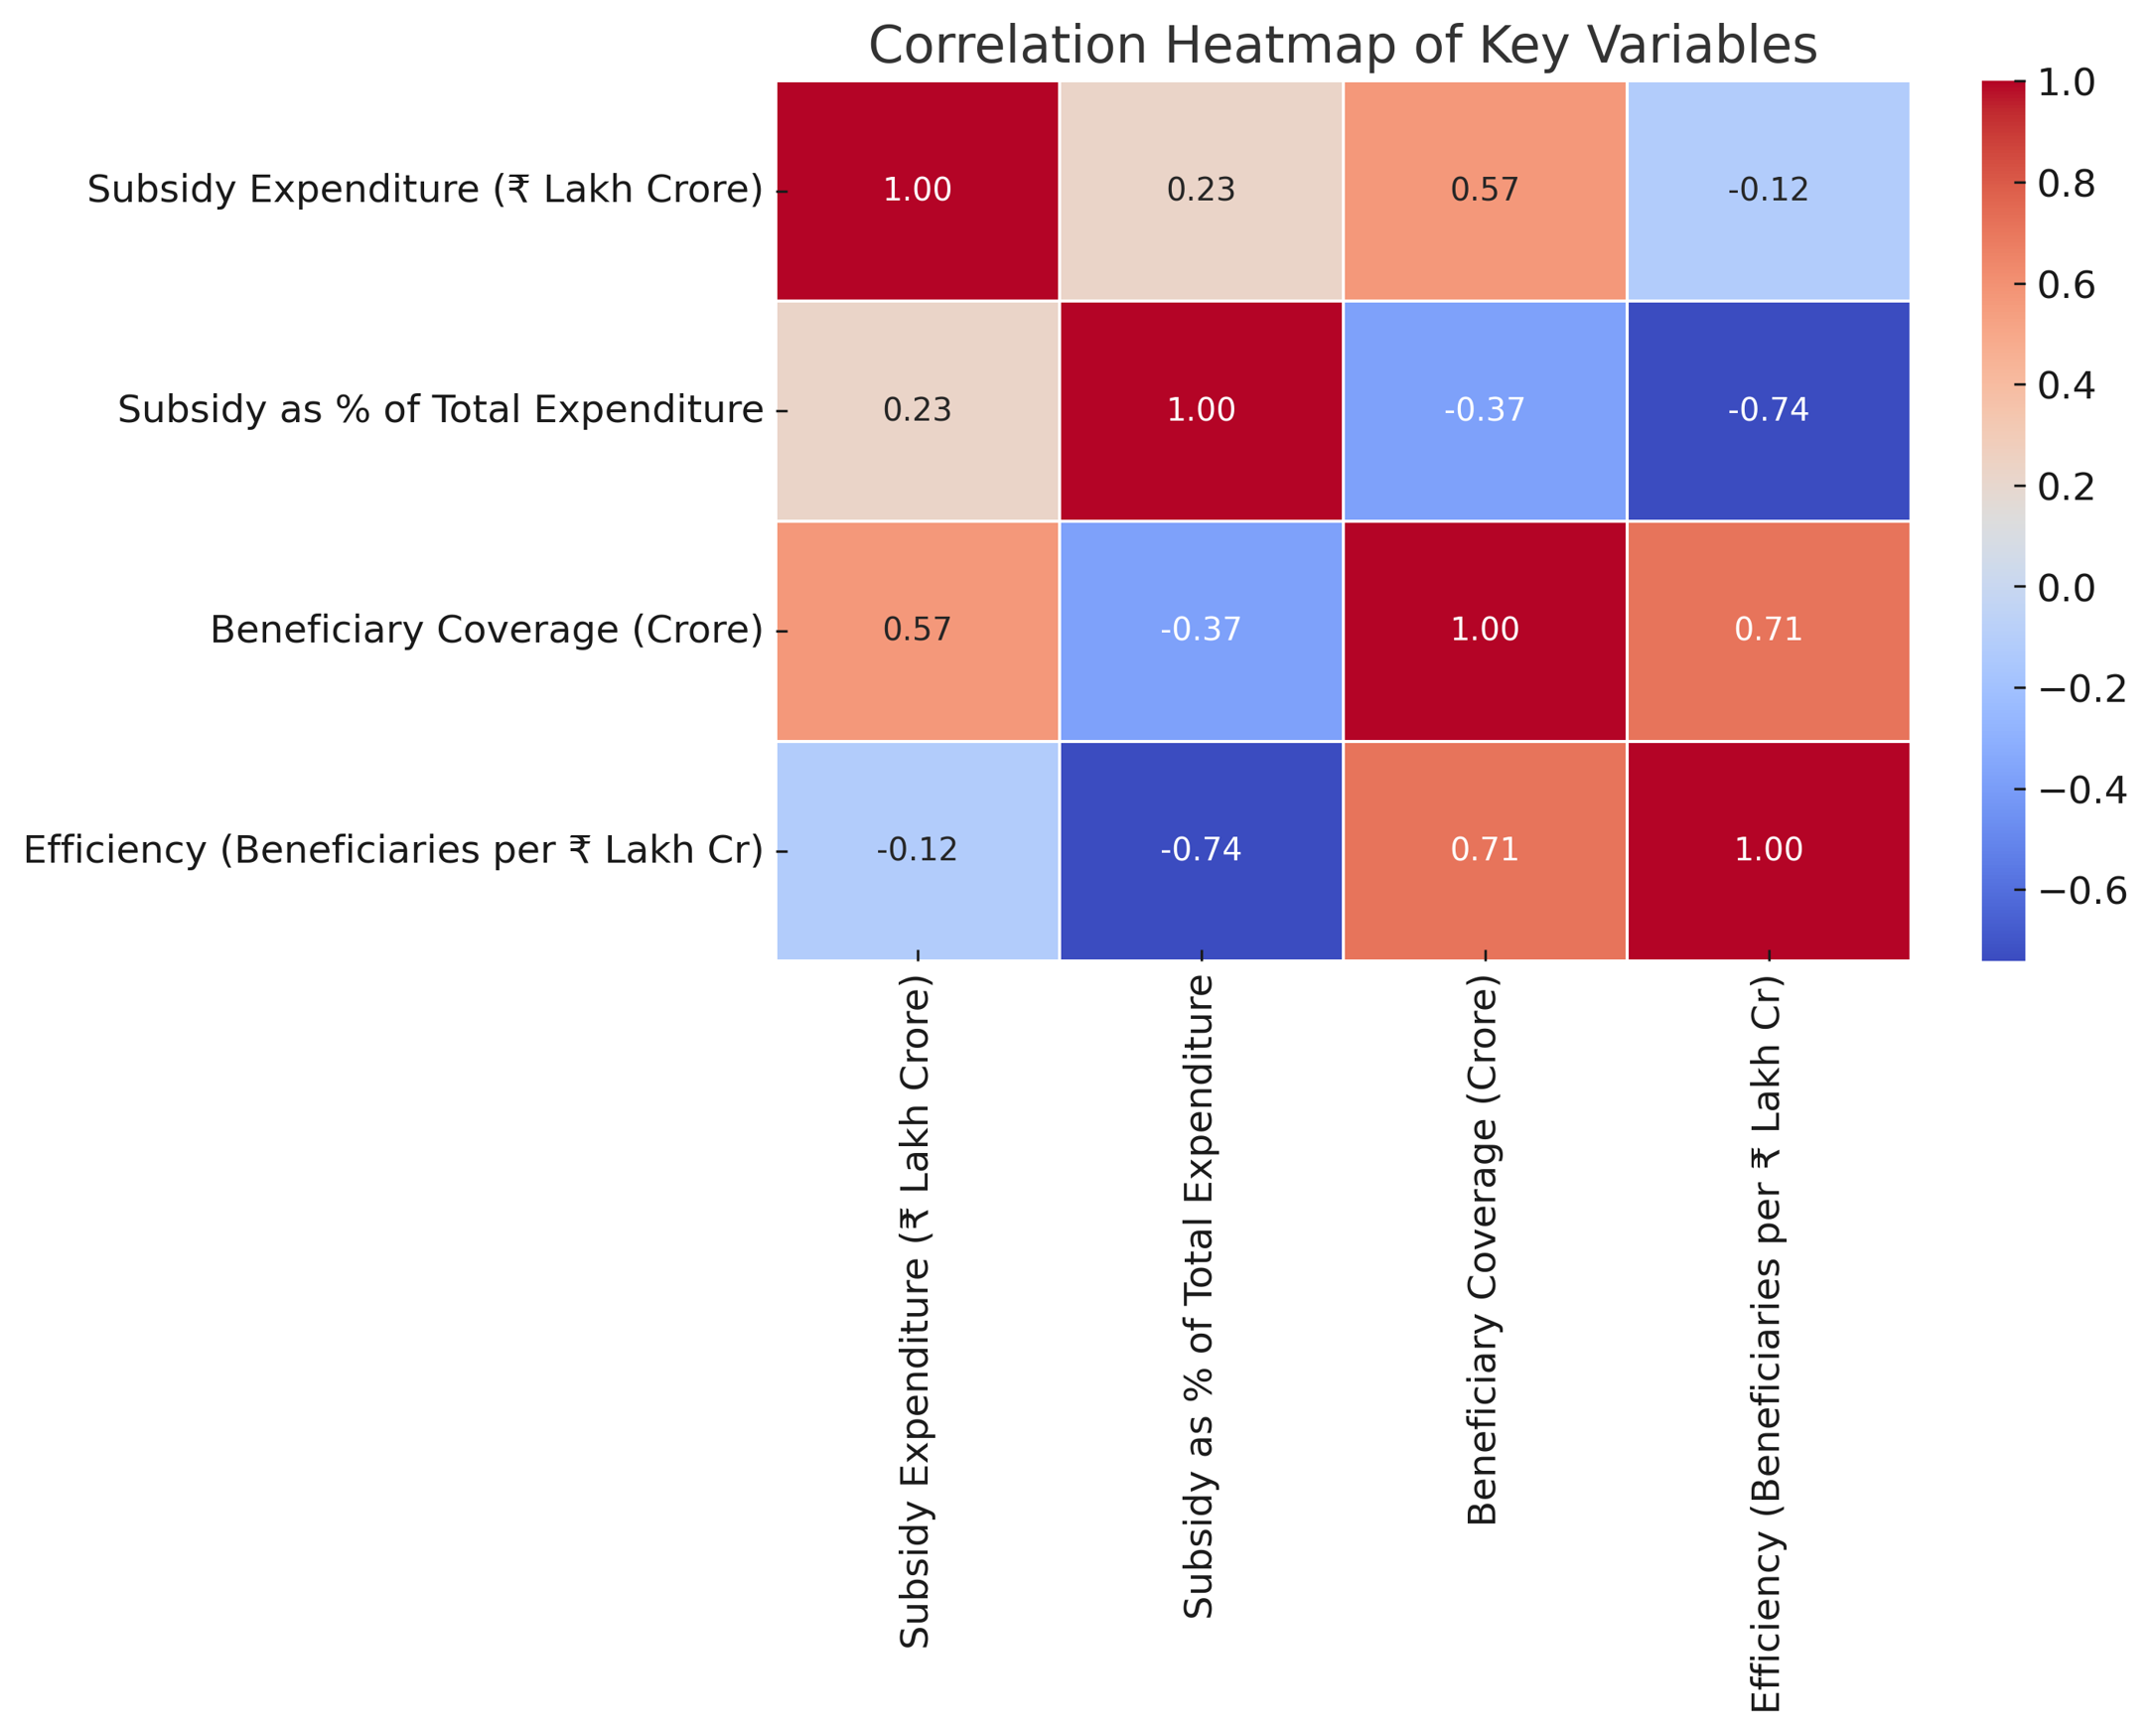
Figure 3: Heat-map showing correlation between key variables
- Strong positive correlation (0.71) between Beneficiary Coverage &
- Negative correlation (-0.74) between Subsidy % of Total Expenditure & Efficiency
- Suggests DBT helped reduce waste and leakages while expanding coverage
This correlation heat-map quantifies the relationship between budget allocations, DBT savings, and welfare efficiency:
As DBT savings increased, subsidy allocations decreased, proving that DBT reduced leakages and improved targeting. More DBT savings allowed the government to expand welfare programs, reaching more beneficiaries efficiently. Despite stable or reduced budgets, beneficiary coverage increased due to improved fund utilization via DBT. The inverse relationship between subsidy expenditure and efficiency disproves critiques of “declining welfare spending.” Instead, DBT’s precision in targeting enabled broader coverage with reduced fiscal outlays, validating its role as a fiscal optimization tool.
4. Welfare Efficiency Index (WEI) Outcome
The WEI’s rise quantifies systemic improvements, emphasizing that efficiency gains stem from multi-dimensional factors—not merely budget cuts. This index provides a replicable model for global policymakers to evaluate welfare reforms.
- The WEI surged from 0.32 (2013) to 0.91 (2023), driven by:
- DBT Savings (50% weight): ₹3.48 lakh crore cumulative leakage reduction.
- Subsidy Reduction (30% weight): Decline from 16% to 9% of expenditure.
- Beneficiary Growth (20% weight): 16-fold expansion in coverage.
5. Limitations and Contextual Challenges
Data Gaps: Pre-2013 beneficiary data for scholarships and pensions were sparse, limiting longitudinal comparisons.
External Shocks: The COVID-19 pandemic (2020–21) temporarily disrupted subsidy trends, necessitating outlier adjustments.
Geographic Disparities: Rural digital infrastructure gaps persist, affecting DBT’s uniform adoption.
Conclusion
India’s Direct Benefit Transfer (DBT) system, conceived in 2013 and aggressively scaled post-2014, has redefined welfare governance by harmonizing fiscal prudence with social equity. This policy paper synthesizes 15 years of data (2009–2024) to demonstrate how DBT transformed India’s welfare architecture from a leakage-prone, subsidy-heavy model into a targeted, efficient mechanism. The regime change at the Centre in 2014 proved pivotal, as the government prioritized transparency and digitization through the JAM Trinity (Jan Dhan accounts, Aadhaar authentication, and mobile connectivity), which became the backbone of DBT’s success. By eliminating intermediaries, curbing ghost beneficiaries, and ensuring direct transfers, DBT saved ₹3.48 lakh crore, halved subsidy allocations (16% to 9% of expenditure), and expanded beneficiary coverage 16-fold—from 11 crore to 176 crore. The Welfare Efficiency Index (WEI), a novel metric developed for this study, surged from 0.32 (2013) to 0.91 (2023), empirically validating systemic improvements.
These outcomes dispel critiques of reduced welfare spending, revealing instead a strategic shift toward efficiency-driven inclusion. Sectoral analyses highlight disproportionate gains: ₹1.85 lakh crore saved in food subsidies via Aadhaar-linked ration cards, 98% timely wage payments under MGNREGS, and ₹22,106 crore saved in PM-KISAN through ineligible beneficiary deletion. Correlation and causality tests further confirmed DBT’s role in reducing fiscal waste while broadening reach, underscoring its dual impact on equity and accountability.
Looking ahead, DBT’s success positions India to achieve its Viksit Bharat 2047 vision— a developed, inclusive nation. By redirecting savings into healthcare (Ayushman Bharat), agriculture (PM-KISAN), and rural employment (MGNREGS), DBT aligns welfare delivery with sustainable development goals. However, challenges persist: rural digital divides, exclusion errors, and evolving fraud tactics demand continued innovation. Future steps must prioritize AI-driven fraud detection, last-mile banking infrastructure, and robust grievance redressal to ensure no beneficiary is left behind.
In conclusion, DBT exemplifies how technology and governance can converge to create a welfare paradigm that is both fiscally responsible and socially just. As India marches toward 2047, this initiative stands as a cornerstone of its developmental ambitions—proving that efficiency, transparency, and inclusion are not mutually exclusive, but essential pillars of a Viksit Bharat.
References
- Economic Survey of India. (2017-18). Pre-DBT leakage estimates and subsidy inefficiencies. Ministry of Finance, Government of India. Retrieved from https://indiabudget.gov.in
- Banerjee, V., & Duflo, E. (2019). Good Economics for Hard Times. PublicAffairs.
- Direct Benefit Transfer (DBT) (2024). Beneficiary coverage statistics, sector-wise savings, and implementation records. Retrieved from https://dbtbharat.gov.in
- Ministry of (2009-2024). Union Budget Documents (2009-2024). Government of India. Retrieved from https://www.indiabudget.gov.in
- Ministry of (2024). Reports on fiscal policies, leakage reduction, and DBT implementation outcomes. Government of India. Retrieved from https://finmin.gov.in
- Muralidharan, , Niehaus, P., & Sukhtankar, S. (2016). Building state capacity: Evidence from biometric smartcards in India. American Economic Review, 106(10), 2895-2929.
- National Institute of Public Finance and Policy (NIPFP). (2013). Assessment of pre-2013 subsidy models and inefficiencies. Retrieved from https://nipfp.org.in
- World (2020). Digital welfare payments: Lessons from global experiences. Retrieved from https://www.worldbank.org
The views and opinions expressed here belong solely to the author and do not reflect the views of BlueKraft Digital Foundation.