


A Quantitative Assessment of Economic and Environmental Gains, Performance Index and Implementation Gaps
Summary
The world’s largest domestic rooftop solar initiative, ‘Pradhan Mantri Surya Ghar: Muft Bijli Yojna’ was launched by the Honourable Prime Minister of India, Shri Narendra Modi on 15th February 2024. After completing one year, the scheme was evaluated based on its financial implications, environmental benefits, and overall state-wise performance index. The findings suggested key points as below:
-
- Cost–Benefit analysis with 6,82,814 number of RTS installations of rooftop solar till 31st January 2025, the net saving amounting to Rs 1,619.95 crores in one year and Rs 36,089 crores projected over 25 years, whereas,
- The estimation of CO2 reduction resulted in the avoidance of roughly 3.59 million tonnes of carbon dioxide (CO₂) emissions in the last one year (considering ~0.82 kg CO₂ per kWh as average grid emission factor) and 89.65 million tonnes of CO₂ when projected over a 25-year system lifespan with the same technology. While the national target was set at 720 million tonnes of CO₂ reduction under the rooftop solar mission over the same period. This is a significant contribution to achieving the net-zero goals by 2070.
- The Performance Index (PI) suggested Gujarat emerged as the national leader with a PI score of 0.85, validating its role as a model state in decentralized solar deployment, In addition to Gujarat other high and moderately performing states (registration to subsidy release ) were found to be Kerala, Uttarakhand, Andra Pradesh, Maharashtra, Uttar Pradesh etc. Among Union Territories, the Lakshadweep and Ladakh were performing exceptionally well.
- The funnel analysis suggested that the high conversion rates of 0.80 (Inspection to installation) and 0.79 (Subsidy disbursal to inspection) indicated that once installations are completed and inspected, the process of releasing subsidies is smooth and efficient. The bottlenecks are found to be predominantly at the initial stages, i.e.,registration, application, and installation, rather than in inspection or disbursal. Addressing these early-stage hurdles could unlock much higher scheme participation and achievement levels.
- Central Government should focus more on expanding rooftop solar capacity in high-potential states like Rajasthan, Telangana, Madhya Pradesh, Chhattisgarh, Punjab, etc, through targeted interventions while replicating best practices from successful states and implementing region-specific intervention with accountability measures in States/UT with difficult terrain and climatic issues like Arunachal Pradesh and other North-Eastern states, Jammu and Kashmir, Andamans and Nicobar etc).
- Additionally, strengthening digital and offline infrastructure and handholding to support underserved populations and senior citizens would remove the initial hurdles, like dropping off registration. Application or installation stages.
- Accelerating domestic manufacturing through incentives, R&D, and strategic collaborations will address supply chain constraints and foster a self-reliant solar industry.
- The skill development programs in solar installation should be accelerated in low-performing states.
Introduction
The rising concerns over climate change and the imperative for renewable energy sources have propelled a global movement towards renewable energy adoption. India, recognizing its significant solar energy potential, has made substantial commitments to augment its renewable energy capacity. A significant initiative in this endeavour is the ‘Pradhan Mantri Surya GharMuft Bijli Yojna’, the world’s largest domestic rooftop solar initiative, launched by Prime Minister Shri Narendra Modi, on 15th February 2024. Recently, on completion of one year (10th March 2025), this transformative scheme achieved the historic milestone of 10 lakh rooftop solar installations and stands out as an impactful and transformative program in India’s renewable energy and Net Zero-2070 journey. This scheme aims to install 30 GW of solar capacity through 1 crore RTS installations and seeks to reduce 720 million tonnes of CO2 emissions over 25 years.
Each solar installation under PMSGMBY aims to reduce the financial burden of grid-based electricity for both the government and households, surplus solar energy generated supplied back into the grid, enabling its productive use in key development sectors, it also offsets carbon emissions equivalent to planting more than 100 trees, driving India towards a cleaner, greener, and self-reliant future. By offering substantial subsidies, easy financing options, and a streamlined digital application process, the scheme powers homes and empowers people. Given this, the present study aims to highlight the financial, environmental implications, and implementation gap of the PMSGMBY scheme over the last one year.
Methodology
The cost-benefit analysis, estimation of CO2 emission reduction, funnel analysis, and performance index calculation have been done using the state-wise DISCOM status report, which indicated 682,814 rooftop solar (RTS) systems till 31.01.25. However, as per MNRE report the current status of RTS installation is more than 10 lakhs.
A) Cost–Benefit Analysis
Calculation of annual electricity generation (kWh):
Annual Generation (kWh) of electricity from solar installation = Capacity (kW) for which subsidy is released X 8760 X CUF
Where 8760 = number of hours in a year (365 X 24), and CUF (Capacity Utilization Factor) is 0.19 (19%).
Thermal Cost (Rs) for one year = Annual Generation from RTS (kWh) X Cost per kWh
Thermal Cost (Rs) for 25 years = Annual Generation from RTS (kWh) X Cost per kWh per year X 25
Where the cost per kWh is Rs. 4.5, based on the average levelized cost of coal power in India.
Therefore, Net savings for 25 years:
Net Savings (Rs) = Thermal Cost (Rs) for 25 years -Subsidy Amount released (Rs) (one time for 25 years)
B) Environmental Implications
Using the installed capacity (kWp), calculate annual electricity generation (kWh) as above:
Annual Generation (kWh) = Capacity Installed (kW)*8760 * 0.19
Where the number of hours in a year (365 X 24) = 8760, and
CUF (Capacity Utilization Factor) is = 0.19 (19%).
Estimation of CO2 emissions reduction:
CO2 Reduction (kg) = Annual Generation (kWh)*Emission Factor, where the emission factor = 0.82 kg CO2/kWh for coal-based power or,
CO2 Reduction (tonnes) = CO2 Reduction (kg)/1000 tonnes CO2/kWh
C) Performance Index
To identify the gaps across the various stages of the scheme i.e. from Public awareness and interest (registration and application) to policy delivery (subsidy) of the PMSGY statewise funnel analysis was performed. In this study, the analysis was structured around seven sequential funnel metrices while factoring in population: i.e., a). Registration per Capita, b). Application Conversion Rate, c). Installation Conversion Rate, d). Inspection Conversion Rate, e). Subsidy Conversion Rate f). Subsidy Capacity per Capita, g). Subsidy Amount per Capita
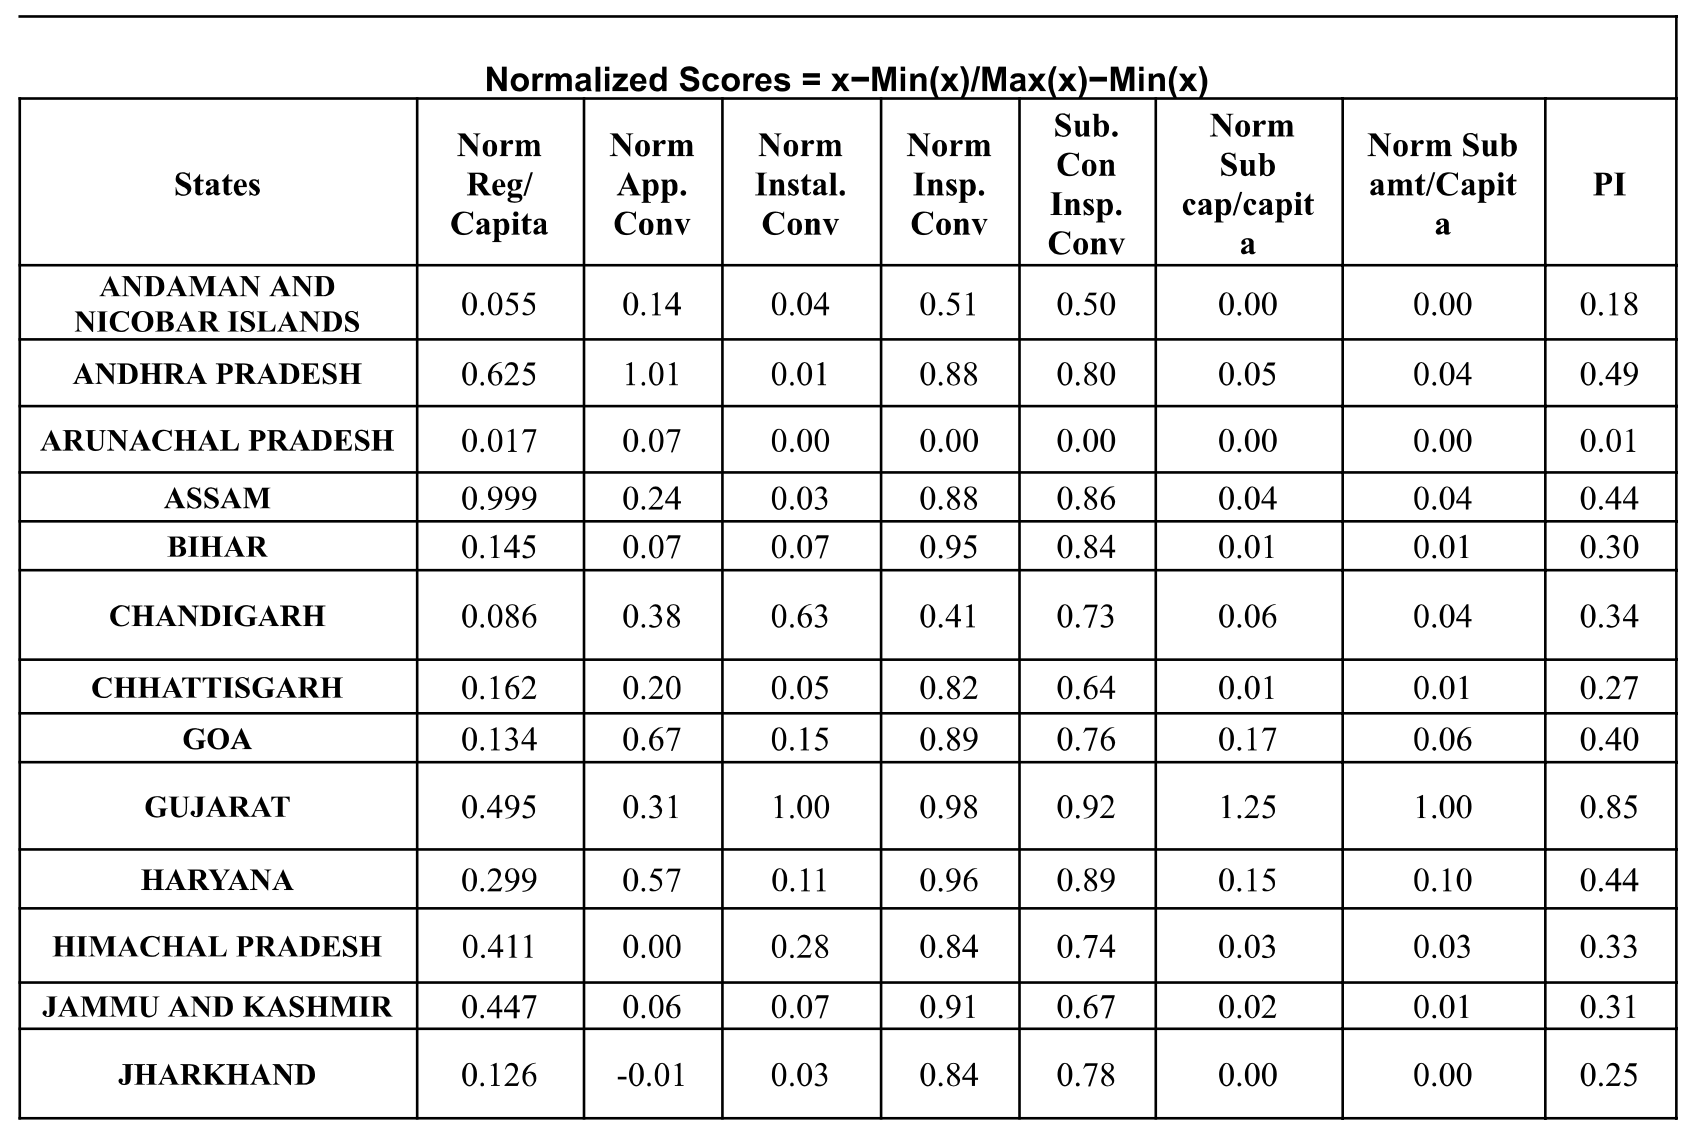
Each designed to evaluate a distinct operational or outcome-oriented aspect of the scheme. Analyzing conversion rates between each stage helps the funnel identify bottlenecks, success patterns, and administrative gaps in real-world implementation. Further, to calculate the performance index, the metrices of the funnel analysis have been normalised by using the formula Normalized Scores = x−Min(x)/Max(x)−Min(x), where x denotes to the funnel matrix and the performance index of the states calculated by dividing total sum of normalised score of each metric of funnel analysis by toal number of funnel matrix and rank them accordingly.
Key Findings
Financial Implications
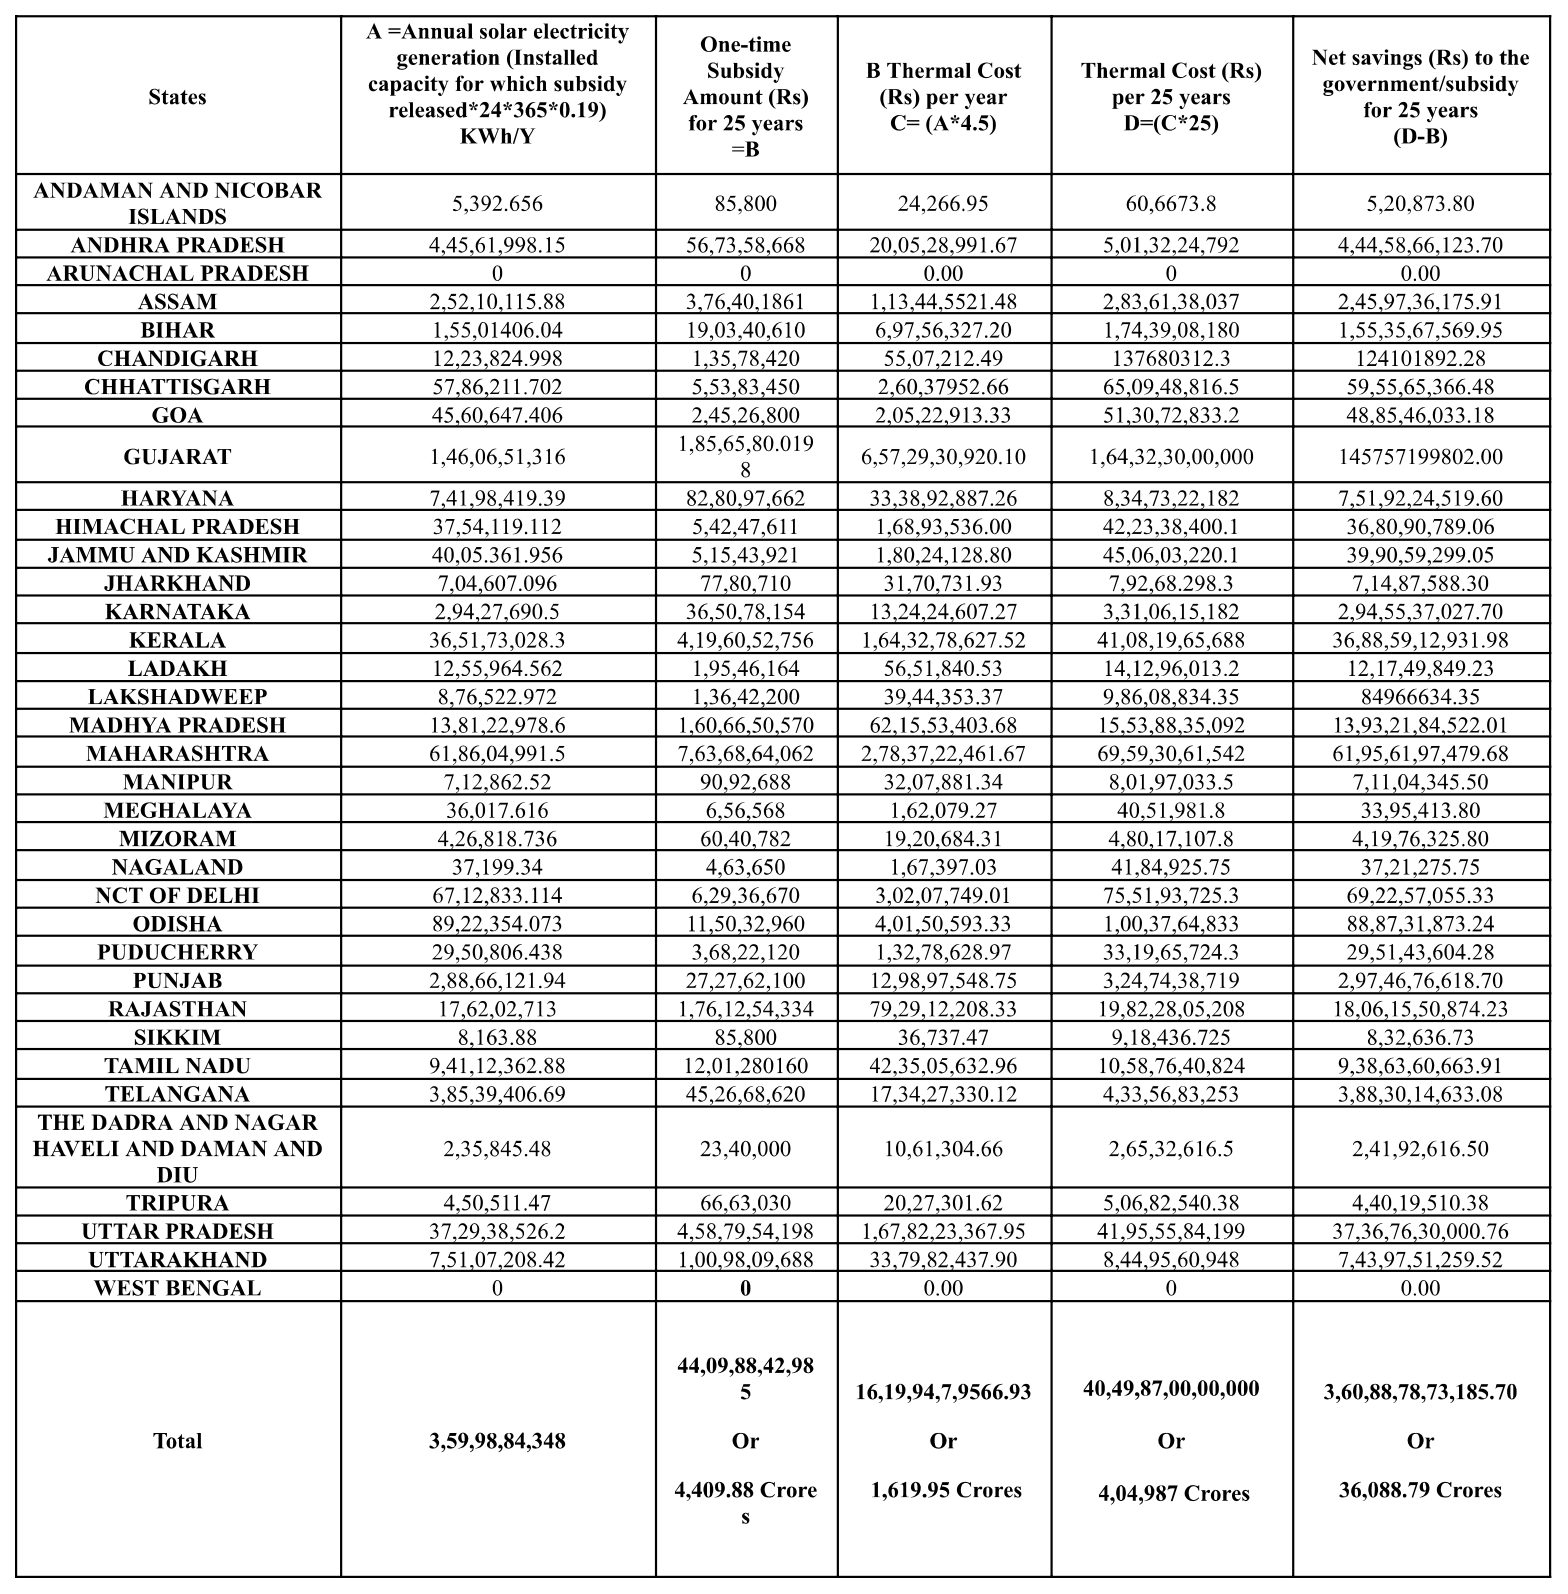
As per the nationally available state-wise DISCOM status report till 31st January 2025, a total of 6,82,814 rooftop solar (RTS) systems have been installed across India, which is equivalent to approximately 26,27,607.68 kilowatt-peak (kWp) installed capacity. Out of this, 21,62,872.12 kWp capacity installations were supported by the government through the provision of a one-time capital subsidy in 25 years, amounting to Rs. 4,409.88 crore (or Rs. 44.10 billion) under the PM Surya Ghar: Muft Bijli Yojana. This subsidized capacity alone was estimated using the above calculation steps to generate around 3.6 billion kilowatt-hours (kWh) of clean electricity annually. When compared with the conventional route of electricity generation through thermal power plants (at an average cost of Rs. 4.5 per unit), the financial implications are striking, as mentioned below:
-
- Annual cost of generating 3.6 billion kWh through thermal power: Rs 1,619.95 crore.
-
- Projected 25-year thermal generation cost for the same capacity: Rs 40,498.7 crore.
-
- The government’s one-time subsidy investment for 25 years is Rs 4,410 crore.
-
- Net savings over 25 years are approximately. Rs 36,089 crore
This analysis demonstrated that the financial returns from investing in rooftop solar were found to be substantial, with savings nearly eight times the upfront subsidy investment. Therefore, the net national savings and contribution to the GDP of the nation would be even more if we extrapolate it to 1 crore (10 million) RTS installations by 2027. Additionally, this excludes indirect benefits such as reduced transmission losses, peak load shaving, and increased household energy resilience, scheme also offers a several other indirect socio-economic, environmental, and strategic benefits, which are hard to quantify in rupees, but significantly amplify the return on investment and justify a more aggressive scaling of the scheme both in urban and rural system.
Table 1: Statewise DISCOM Status Report (Till 31.01.2025)
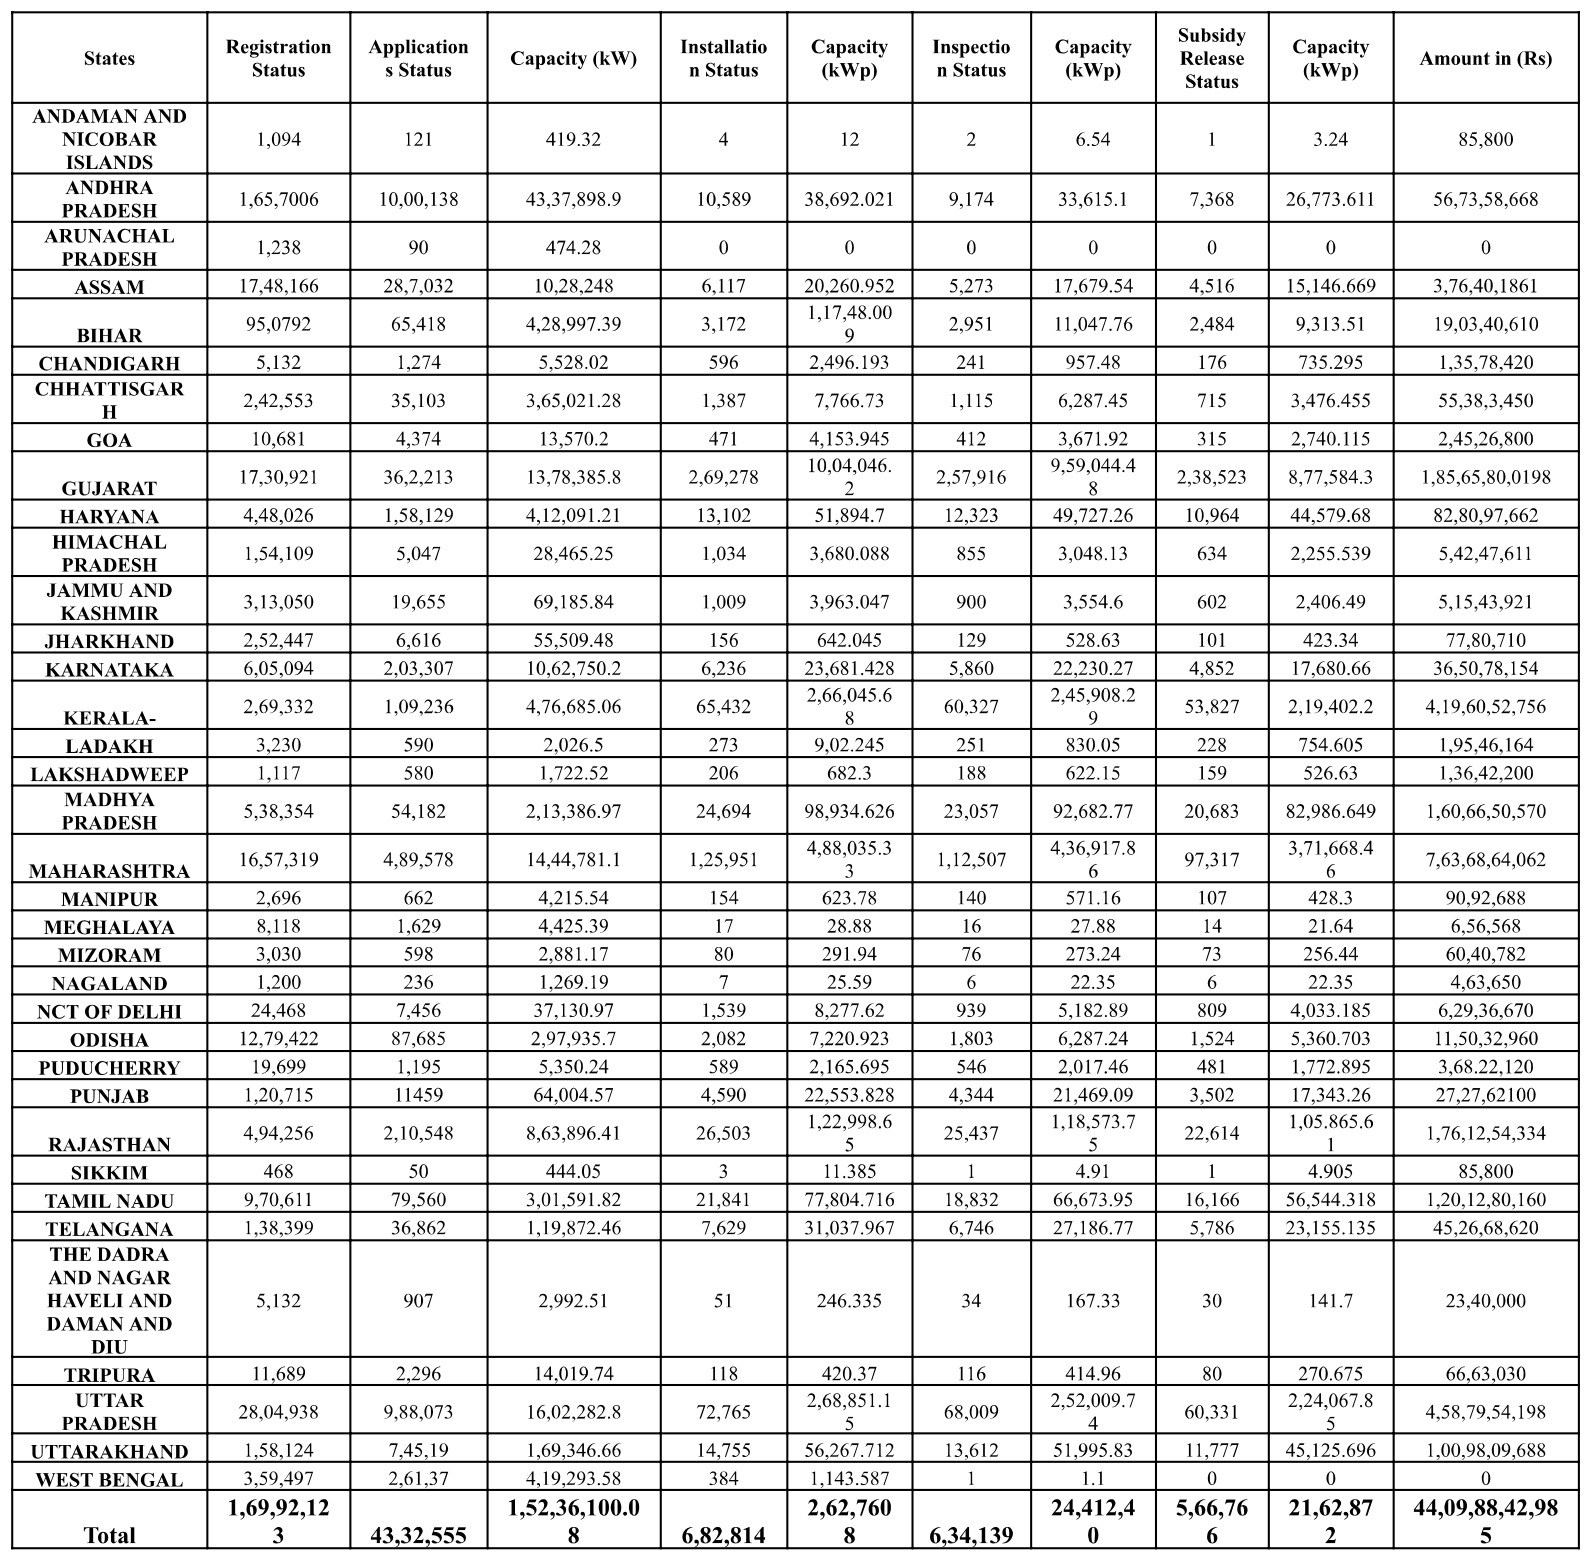
Table 2: Cost-Benefit Analysis of The Scheme
Environmental Implications
Total installed capacity of 26,27,607 kWp from just 6,82,814 RTS installations in last one year was used to calculate the electricity generation per year which is approximately 4.37 billion kilowatt-hours (kWh) of electricity from RTS per year, resulted in the avoidance of roughly 3.59 million tonnes of carbon dioxide (CO₂) emissions in one year, considering ~0.82 kg CO₂ per kWh as average grid emission factor. When projected over a 25-year system lifespan with the same technology, the cumulative emissions avoided could exceed 89.65 million tonnes of CO₂, which is a significant contribution to India’s climate goals. While the national target was set at 720 million tonnes of CO₂ reduction under the rooftop solar mission over the same period.
It is noteworthy that it has achieved significant results with just 6,82,814 household RTS installations. If the scheme is scaled up to reach even 10–15% of Indian households, the potential climate impact could increase exponentially, offering the nation a strategic opportunity to:
a. Achieve its Nationally Determined Contributions (NDCs) under the Paris Agreement much ahead of time,
b. Significantly reduce its dependency on fossil fuel-based thermal power,
c. Build resilient, decentralized, people-centric renewable energy systems at the household level.
Table 3: Reduction in Carbon Dioxide (CO 2 ) Emissions
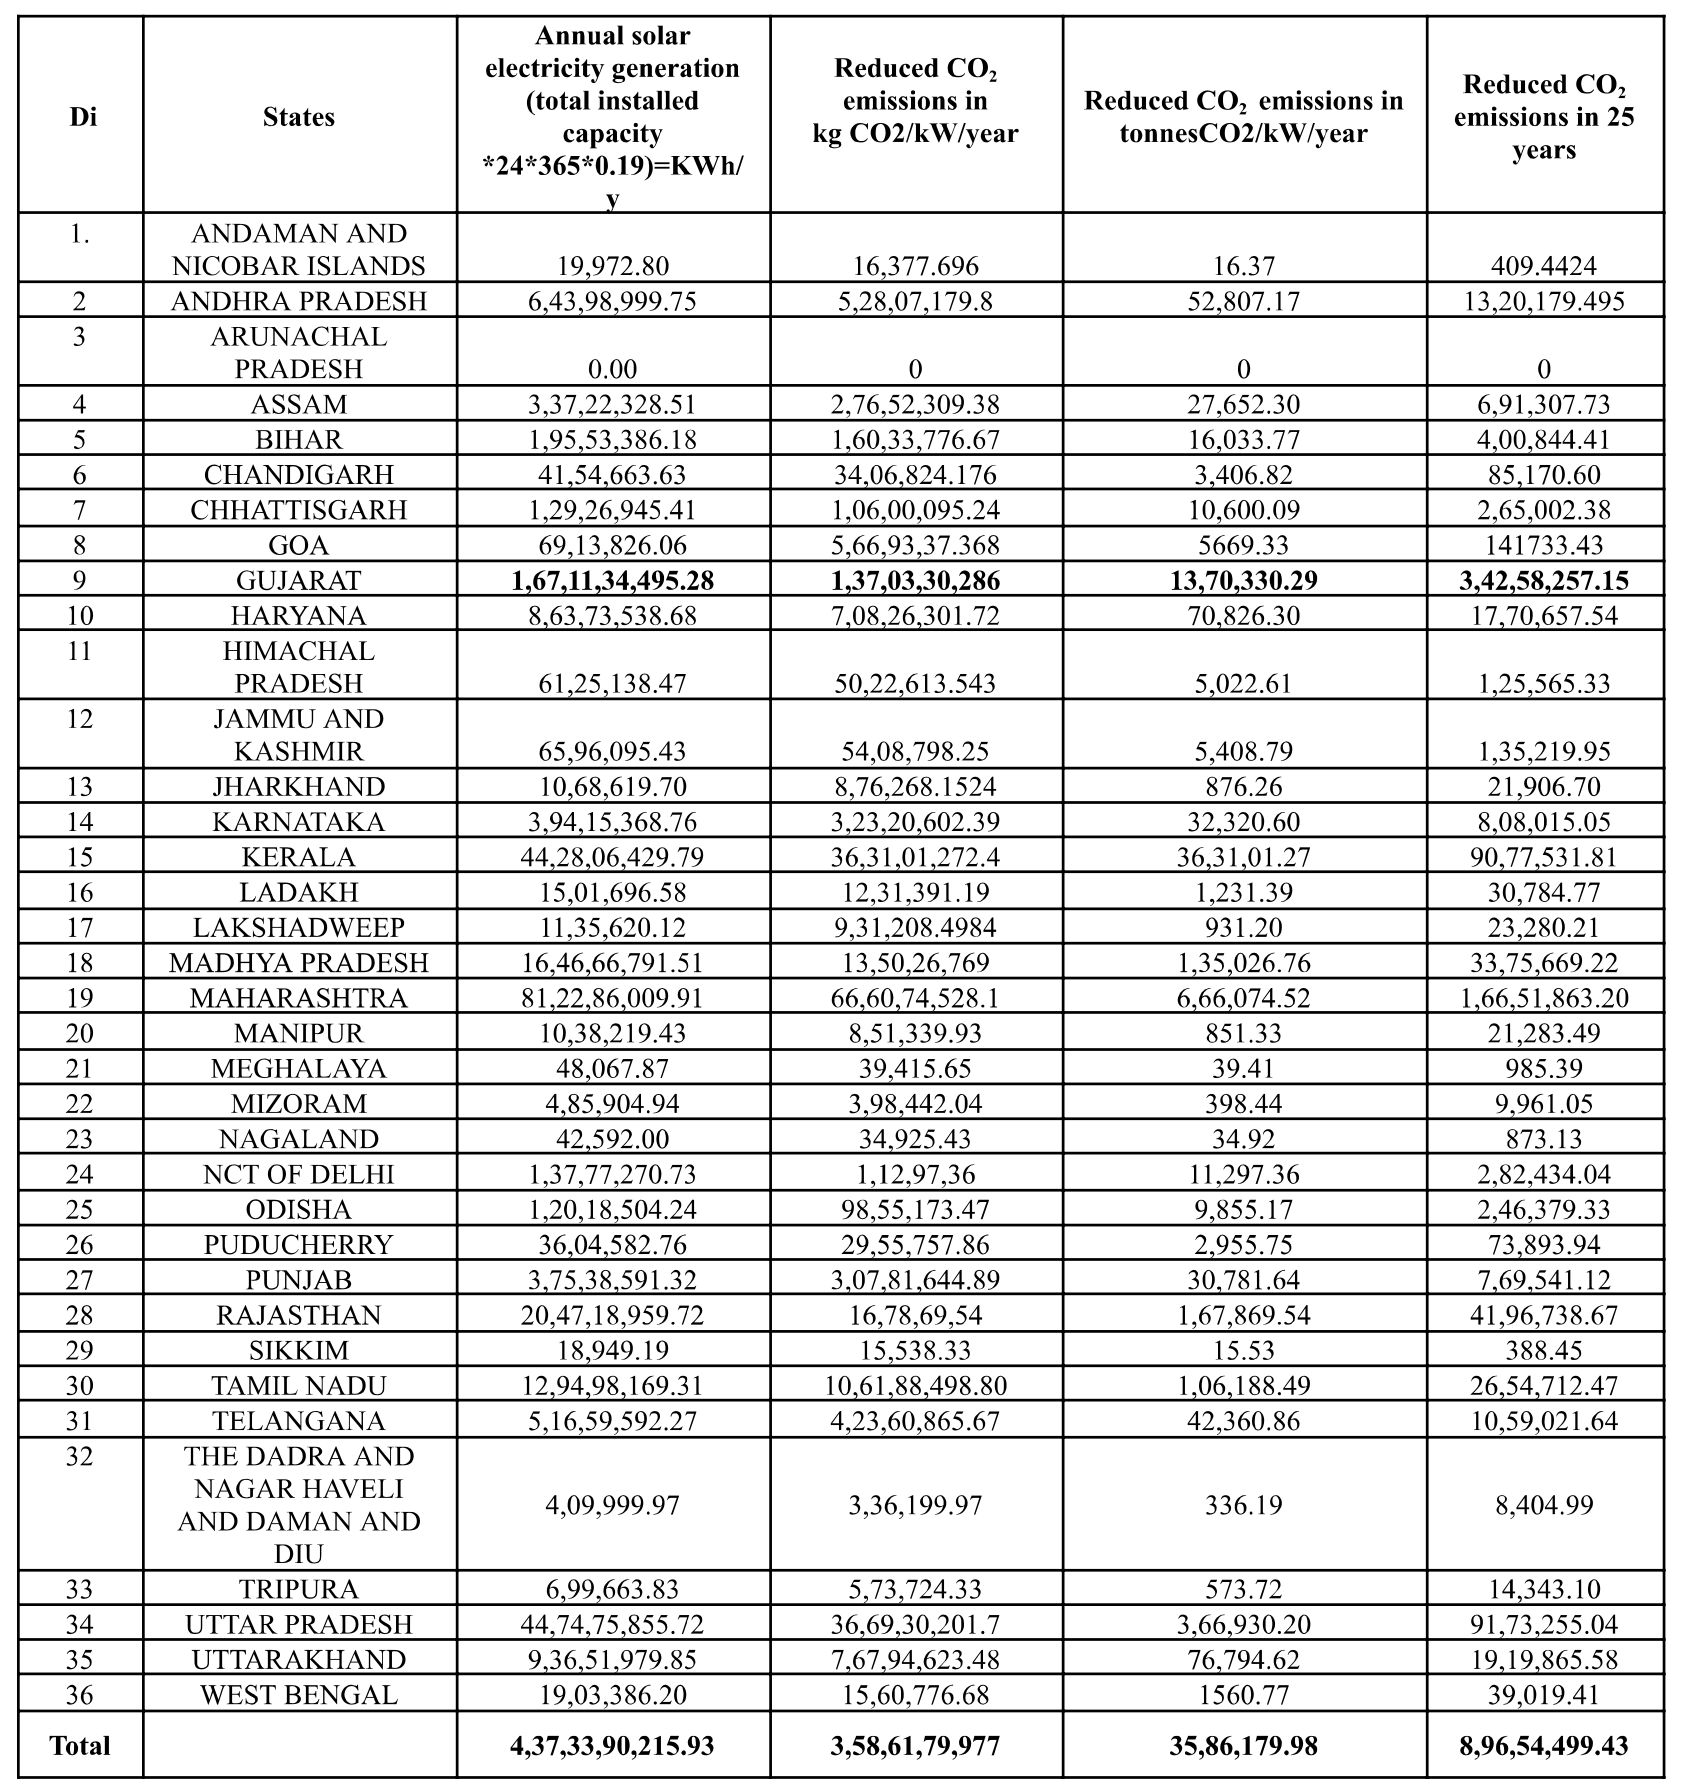
*This calculation is for 6,82,814 no of RTS installation till 31.01.25
Performance Index
To assess the overall implementation effectiveness of the scheme, a Performance Index (PI) was calculated using normalized scores across the seven funnel metrics. This composite indicator provides a holistic view of a state’s ability to translate policy intent into measurable outcomes.
-
- Gujarat emerged as the national leader with a PI score of 0.85, validating its role as a model state in decentralized solar deployment. Furthermore, Gujarat’s better performance in the implementation of the PM Surya Ghar Muft Bijli Yojana (PMSGY) is not coincidental — it is the result of a decade-long strategic alignment of policy, infrastructure, public engagement, and institutional readiness (Proactive State Government and DISCOM Support). Years of campaigning under Surya Gujarat and now PM Surya Ghar have led to high awareness levels among the public about the financial and environmental benefits of rooftop solar., Government messaging has emphasized savings on electricity bills, creating a strong demand-side pull.
- In addition to Gujarat, other high and moderately performing states (registration to subsidy release) were found to be Kerala, Uttarakhand, Andhra Pradesh, Maharashtra, Uttar Pradesh, etc. Among union territories, the Lakshadweep and Ladakh are performing exceptionally well. The reason for better performance for these states is mainly attributed to proactive state policies, efficient administrative processes, robust awareness and outreach campaigns, coordination between DISCOM and vendors, and higher digital and financial literacy. These states showed better conversion rates from registration to subsidy release, reflecting effective implementation.
- It is to note that although states like Uttarakhand and Andhra Pradesh were found to be efficient in the process, as exhibited in the Funnel analysis, their limited number of installations, as compared to other higher-performing states, restricts their overall impact. Conversely, states like Maharashtra and Uttar Pradesh, despite moderate funnel efficiency, achieve large-scale outcomes due to a proactive state government, effective outreach programs, and high demand resulting from a large population. This contrast highlights the importance of both implementation efficiency and capacity scale in achieving national targets.
- West Bengal and Arunachal Pradesh exhibited as low-performing states for this scheme, with the PI score of 0. However, the reasons for low performance by both states are different. In West Bengal, it is mostly attributed to administrative inertia and lack of institutional drive, despite having conducive conditions for urban and semi-urban rooftop solar adoption. Whereas, the underperformance of Arunachal Pradesh is mostly owing to structural and logistical barriers like terrain, erratic weather conditions, settlement patterns (Sloped, non-concrete rooftops made up with bamboo and tin) unsuitable for solar panel mounting, and lack of digital access.
Table 4: Stage-Wise Funnel Analysis
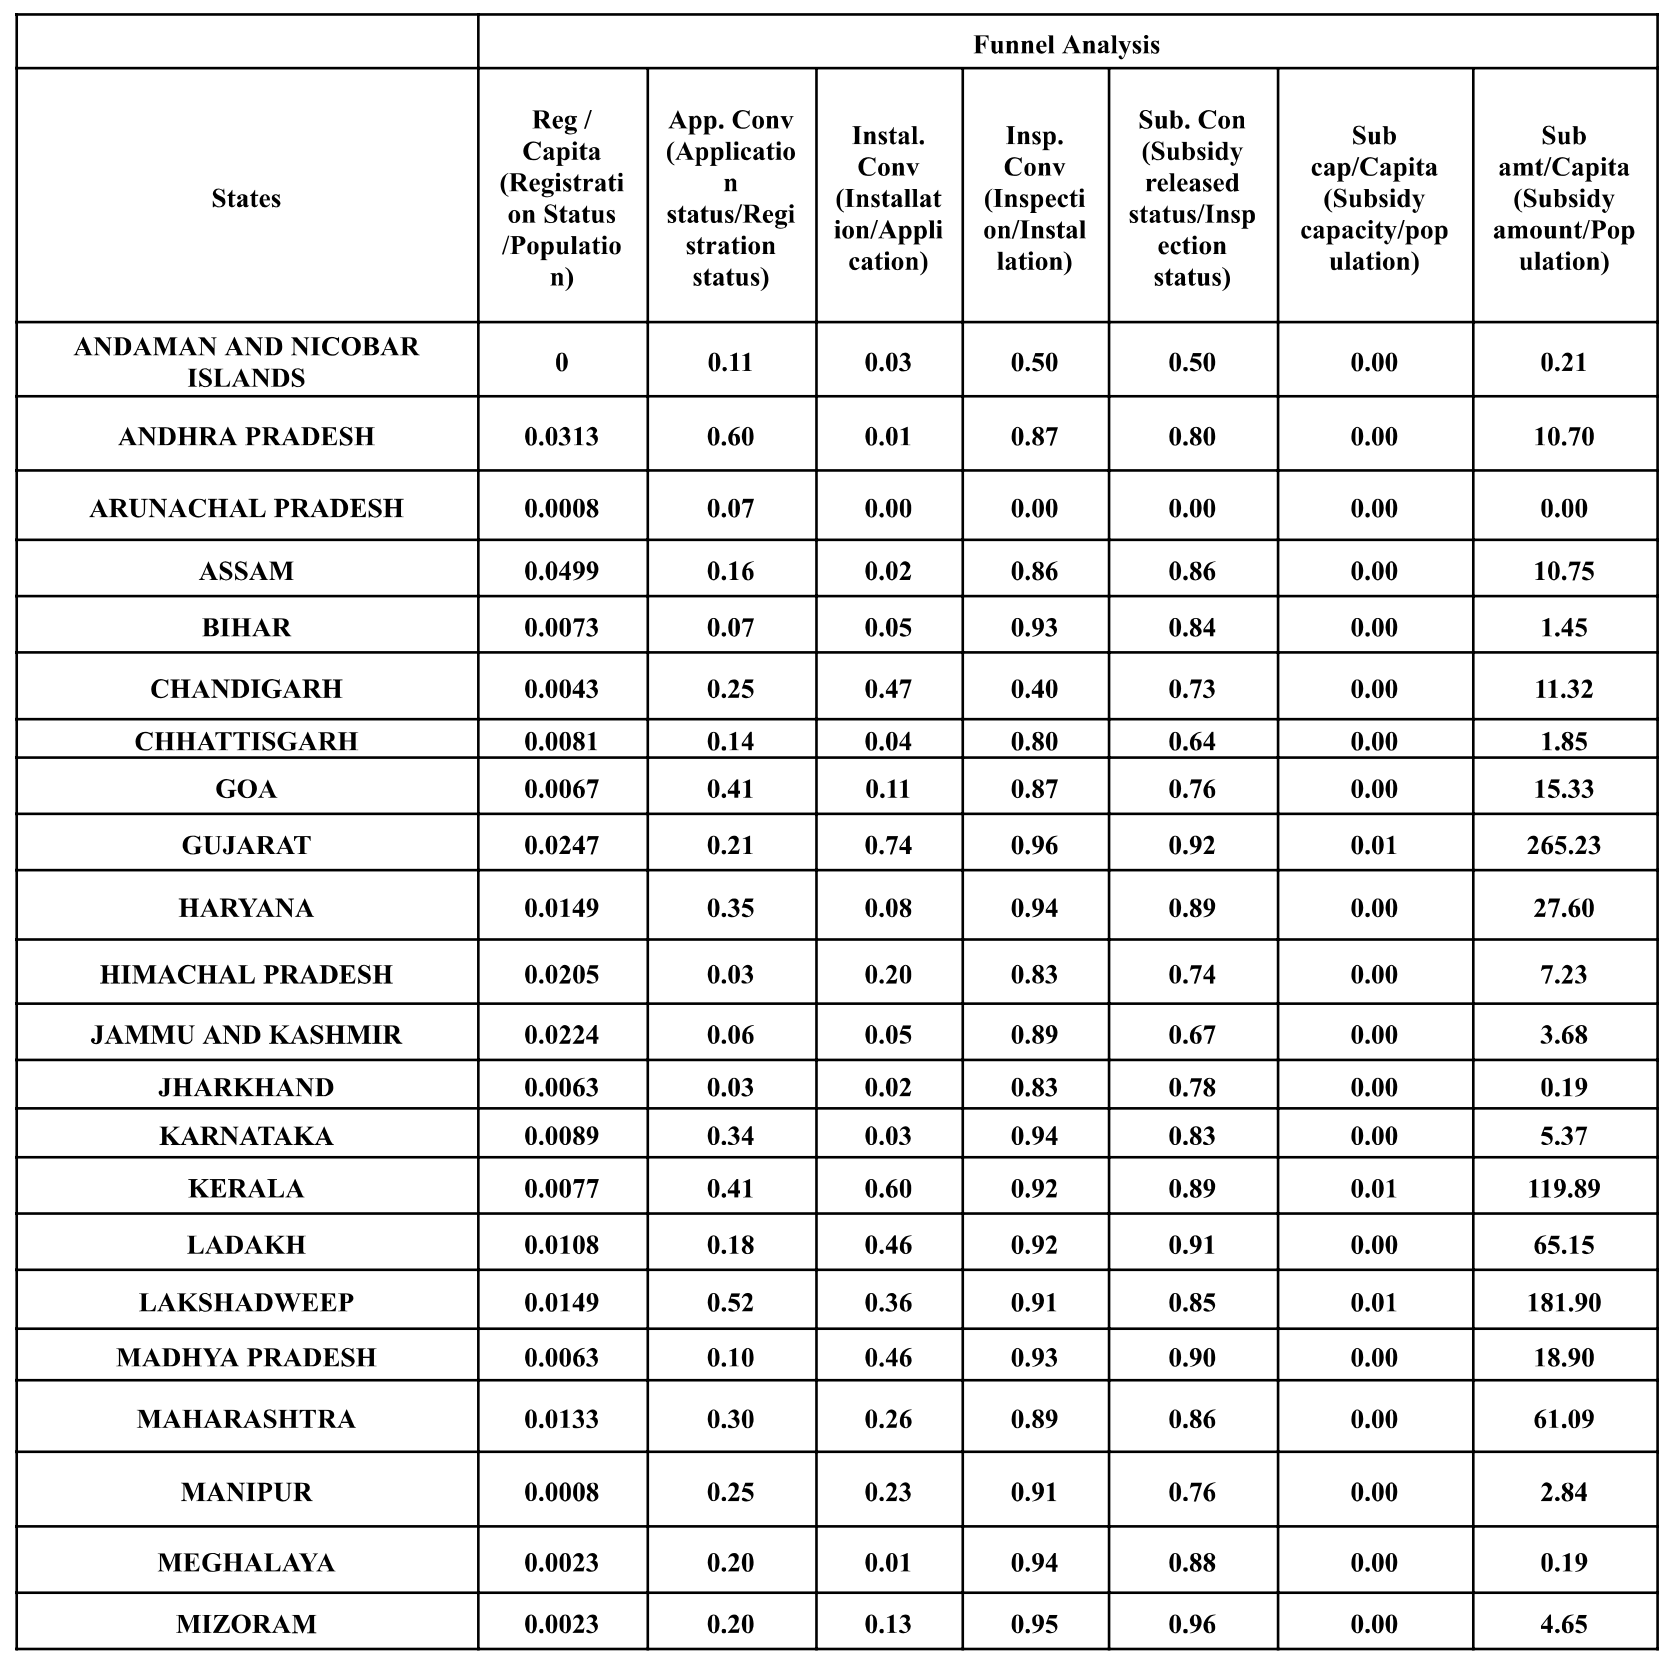
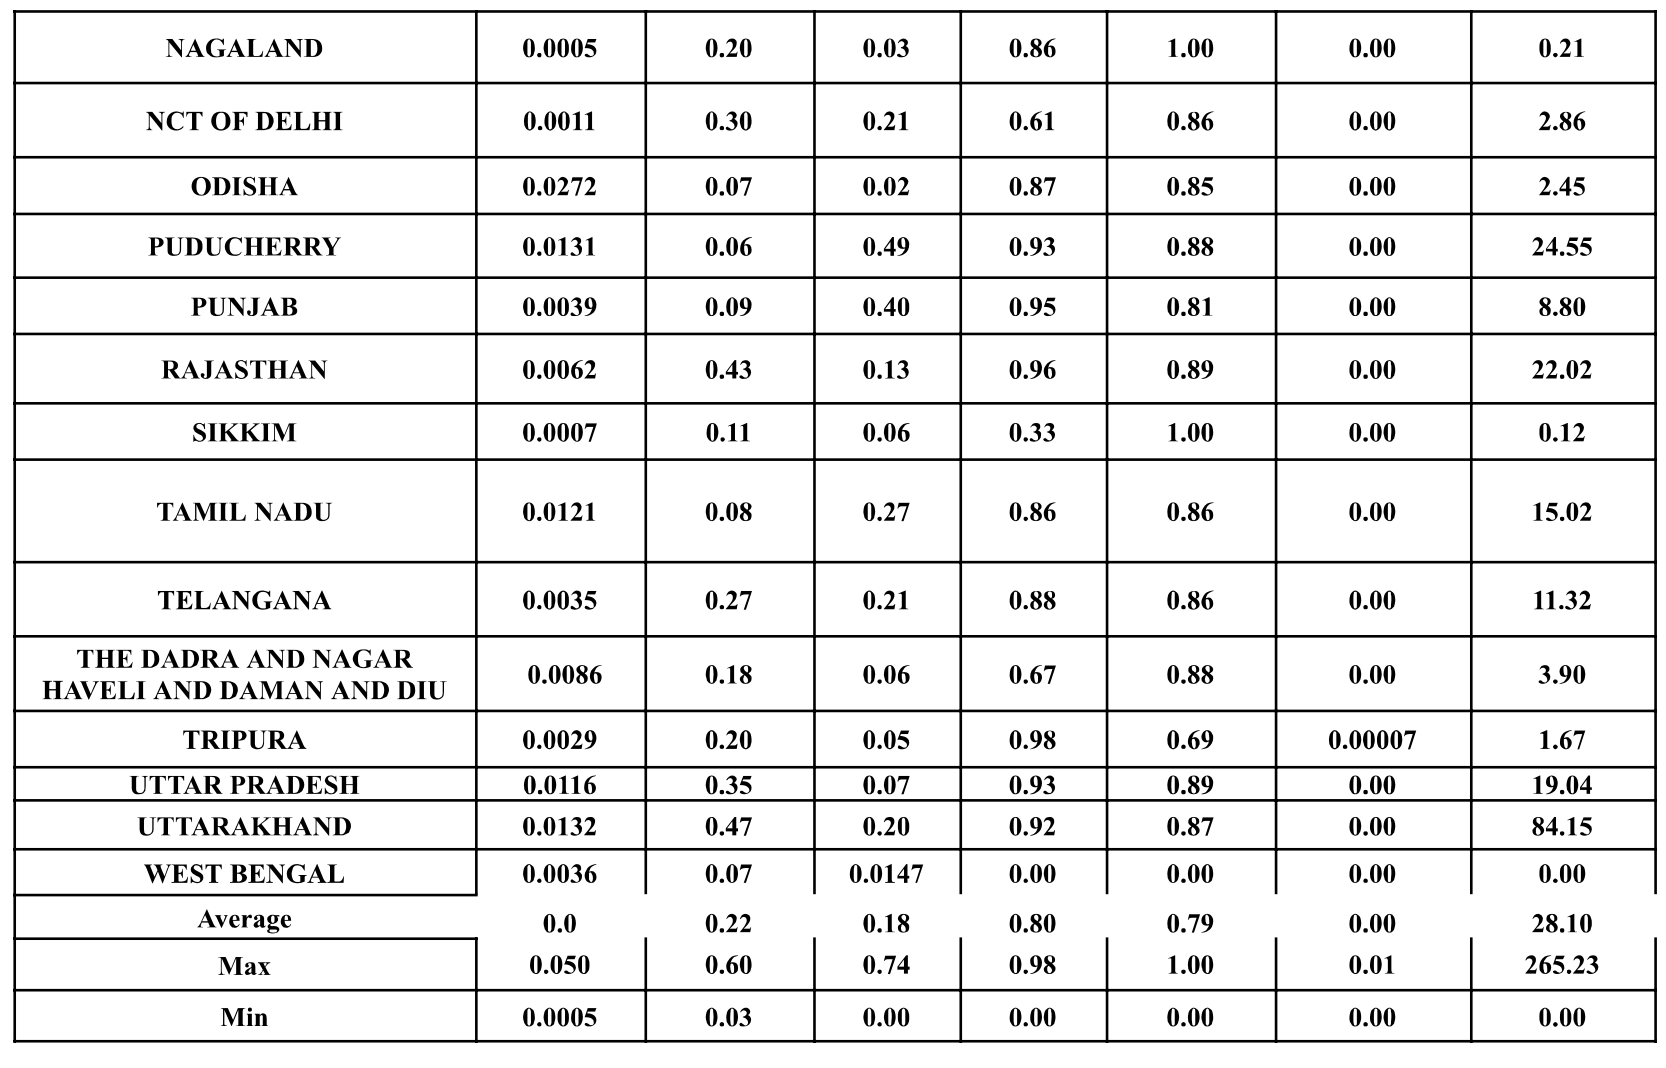
Table 5: State-wise Performance Index
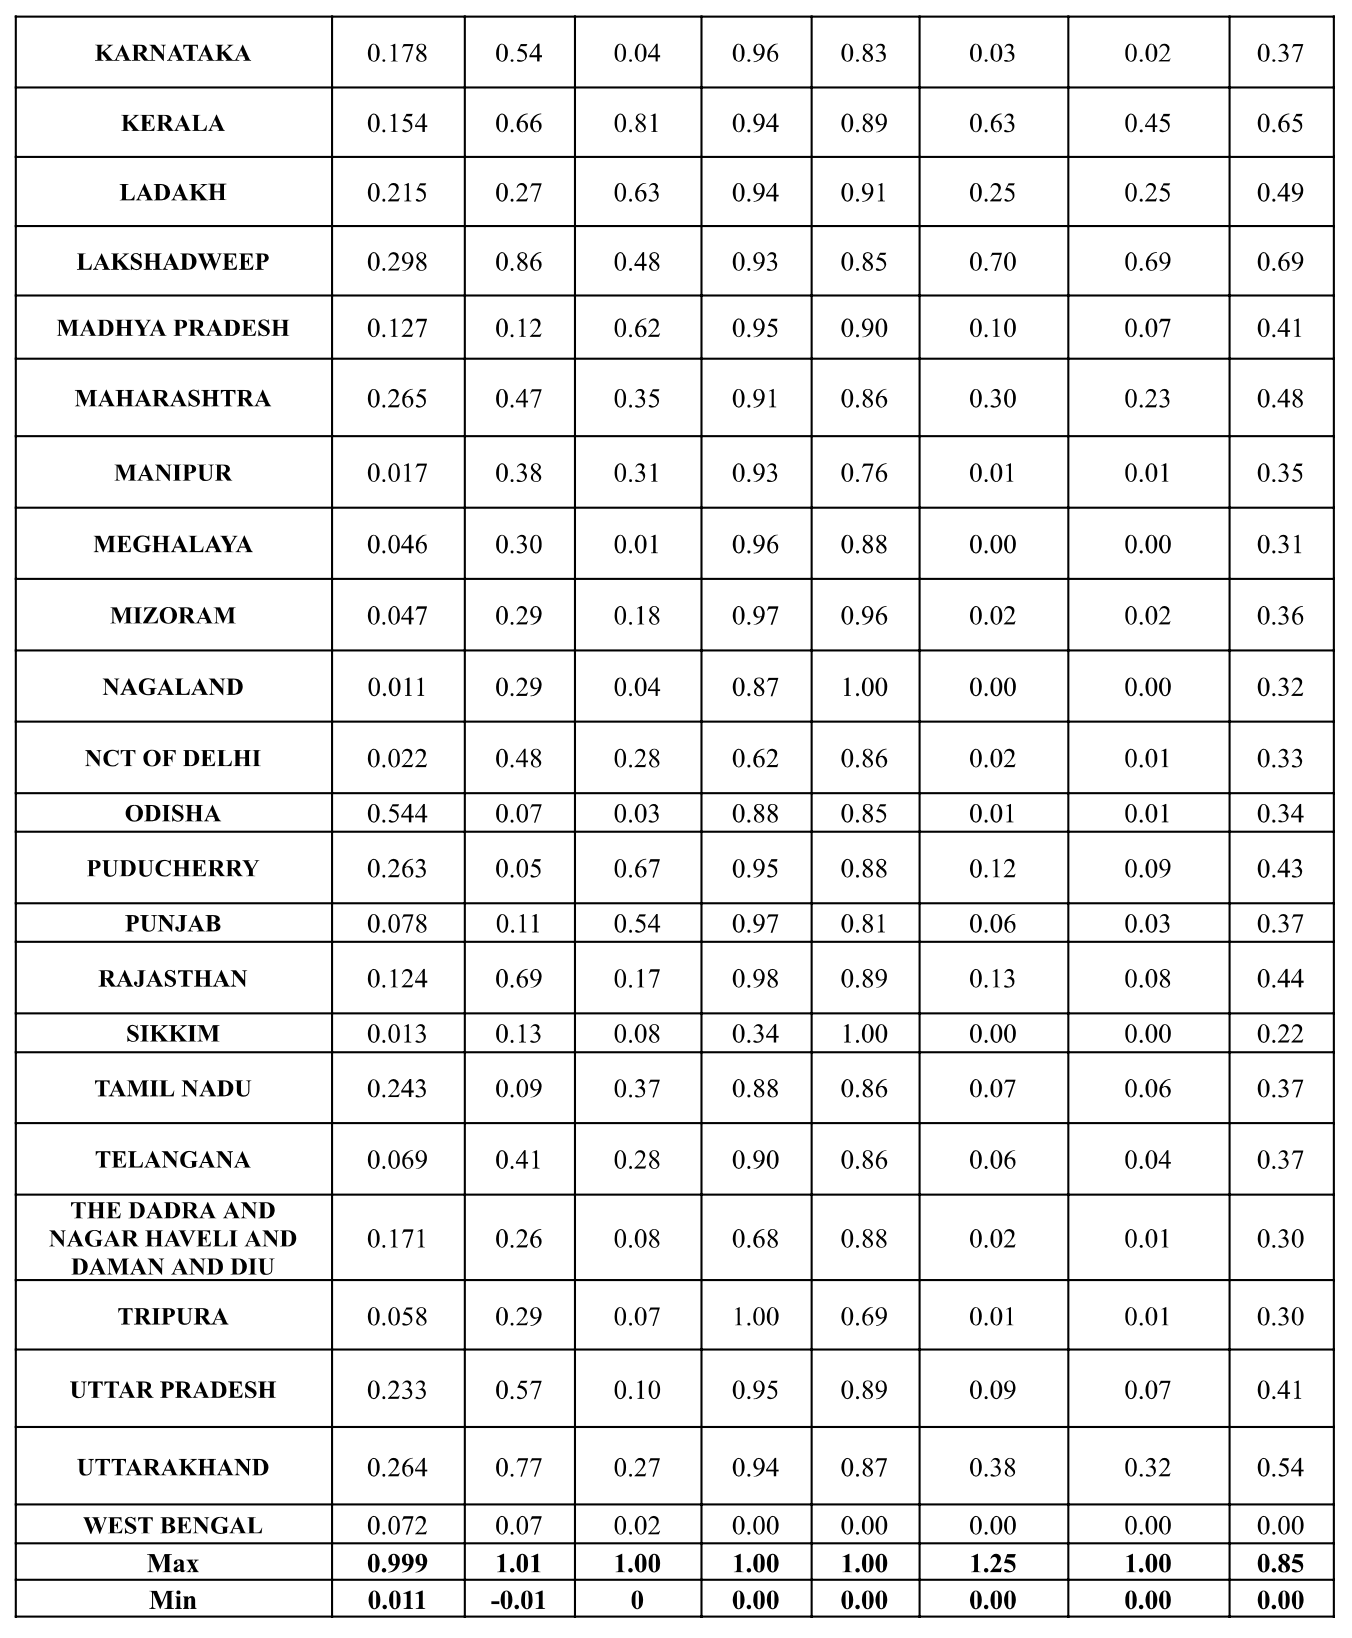
Performance Index of PM Surys Ghar Yojna in Indian States and Union Territories
Performance Index of PM Surya Ghar Yojna in Indian States and Union Territories
Policy Recommendation:
-
- Targeted Capacity Expansion in High-Potential States
States like Maharashtra, Uttar Pradesh, and Rajasthan should be supported with additional central assistance and performance-based incentives to scale up rooftop solar (RTS) installations, given their large populations and solar potential. - Replication of Best Practices from High-Performing States
The successful administrative models of Gujarat and Kerala, such as streamlined application processes, strong DISCOM coordination, and extensive public awareness drives, should be documented and replicated in lagging states through capacity-building workshops. - Bridge the Awareness-Action Gap
High registrations but poor application and installation conversion (as seen in some states) indicated a trust or procedural barrier because for many households, solar energy still remains a distant concept, requiring intensified awareness campaigns and trusted “buddy” agencies to guide consumers through the process.
It was observed from the household survey that mouth-to-mouth publicity proved to be very instrumental. Therefore, the government should invest more in hand-holding support, especially for rural households, possibly through panchayati raj institutions, Self-Help Groups (SHGs), and local solar ambassadors. - Region-Specific Interventions for Low-Performing States
States like West Bengal, with low funnel performance and negligible installations, need region-specific interventions, such as establishing a high-level task force and appointing district-level nodal officers for more coordination and accountability. Linking rooftop solar targets to departmental KPIs. Collaborations with premier technical institutions like IIT Kharagpur, Jadavpur University, Indian Institute of Science Education and Research, Kolkata (IISER Kolkata), and National Institute of Technical Teachers’ Training & Research (NITTTR, Kolkata) can enhance awareness, interest, inspection, training, and monitoring capabilities. Incentivize DISCOM Participation. Since DISCOMs are critical to inspection and subsidy disbursal, performance-based incentives and accountability frameworks should be introduced to improve timelines and reduce delays in installation and subsidy release. - Ensure Digital and Physical Infrastructure Support for Senior citizens, the less educated, and the economically weaker sections
Strengthen digital platforms for application and tracking, but also provide offline assistance in underserved and low-literacy areas through CSCs (Common Service Centres) and local energy service providers. - Smart Meter Installation
Speed up the process of smart meter installation in low-performing states, followed by the configuration of the net meter. - Strengthen Domestic Solar Manufacturing
To overcome supply chain constraints and boost manufacturing capacity, India should accelerate the development of domestic solar manufacturing infrastructure by providing targeted incentives and establishing special economic zones. Investing in R&D and fostering collaborations with global partners can enhance technology and scale up indigenous production.
- Targeted Capacity Expansion in High-Potential States
Conclusion
The above study reveals that the ‘PM Surya Ghar: Muft Bijli Yojana’ has made remarkable strides in promoting rooftop solar adoption with net savings of Rs 1619.94 crores in one year and Rs 36,089 crores projected over 25 years, considering only the 682,814 number of RTS installations of rooftop solar till 31st January, 2025. Furthermore, the estimation of CO2 reduction resulted in the avoidance of roughly 3.59 million tonnes of carbon dioxide (CO₂) emissions in the last one year (considering ~0.82 kg CO₂ per kWh as average grid emission factor) and 89.65 million tonnes of CO₂ when projected over a 25-year system lifespan with the same technology. While the national target was set at 720 million tonnes of CO₂ reduction under the rooftop solar mission over the same period. This is a significant contribution to achieving the net-zero goals by 2070.
From the stagewise funnel analysis, it was also observed that there are no significant hurdles in the inspection and subsidy disbursal stages of the scheme. The high conversion rates of 0.80 (Inspection to installation) and 0.79 (Subsidy disbursal to inspection) indicate that once installations are completed and inspected, the process of releasing subsidies is smooth and efficient. In essence, the bottlenecks are predominantly at the initial stages, i.e., registration, application, and Installation, rather than in inspection or disbursal. Addressing these early-stage hurdles could unlock much higher scheme participation and achievement levels.
The views and opinions expressed here belong solely to the author and do not reflect the views of BlueKraft Digital Foundation.